Welcome!
Here you’ll find interactive Tableau dashboards that turn raw data into insightful visualizations. Each project includes:
- The dataset and business context.
- The visualizations and design choices.
- Key insights and actionable conclusions.
Explore these projects to see how I transform data into compelling visual stories.
Washington Airbnb Market 2016
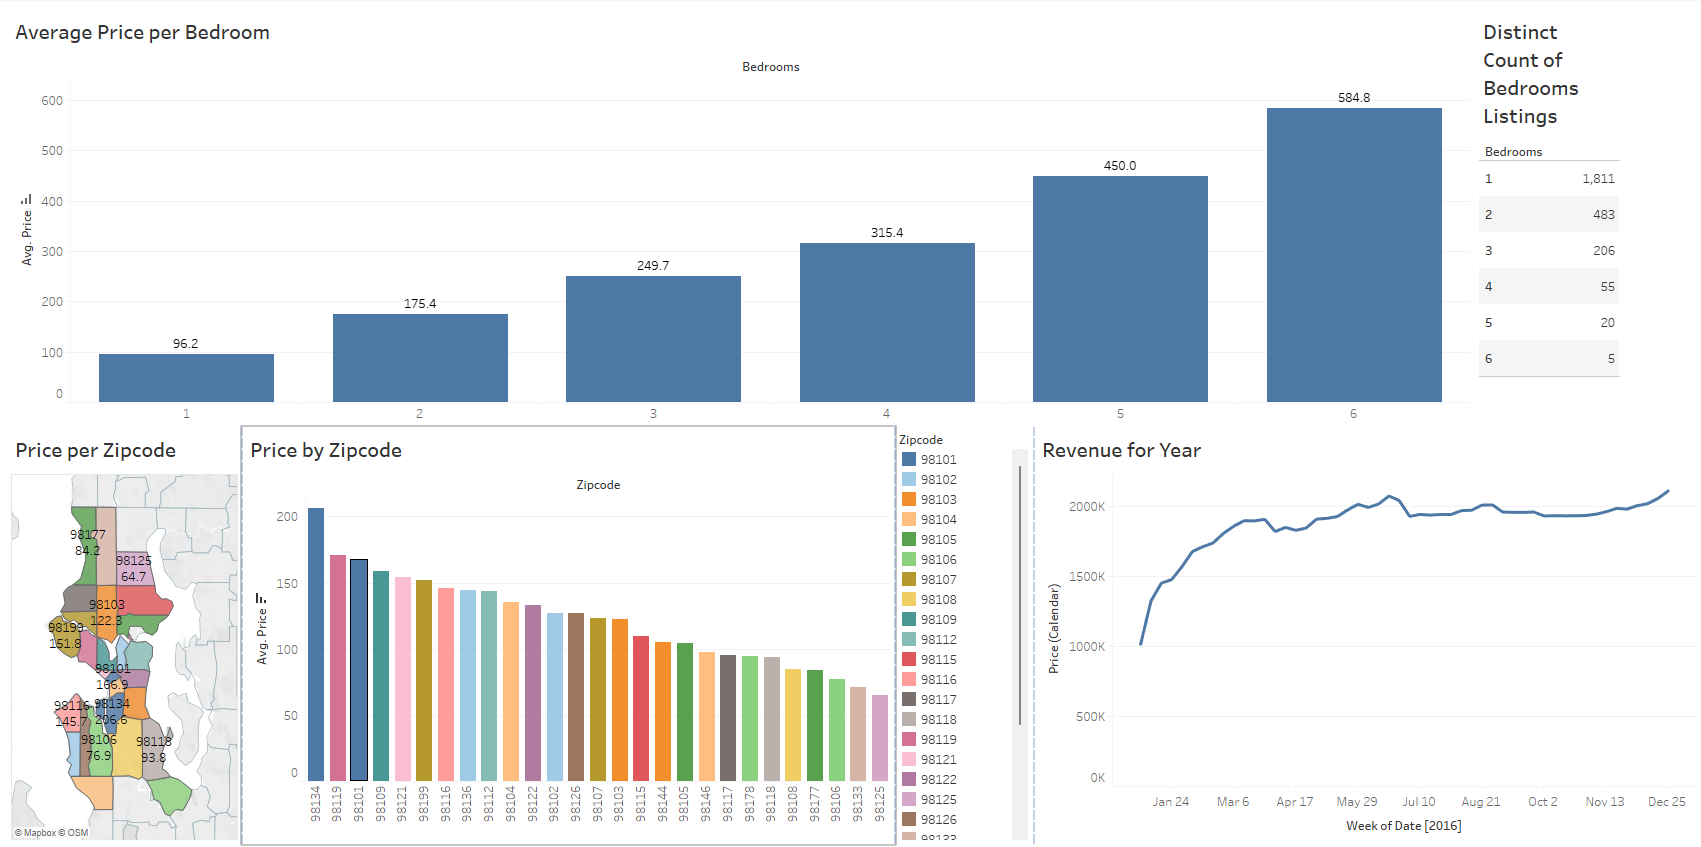
This repository contains a Tableau project created using Tableau version 18.1. It includes multiple worksheets and a dashboard that visualize data from a data source.