Welcome!
Here you’ll find Power BI projects that highlight my expertise in transforming raw data into interactive dashboards and actionable insights. Each project includes:
- The dataset and data sources used.
- The methodology applied.
- Key insights and outcomes.
Feel free to explore the projects and see how I use Power BI to create meaningful data visualizations and drive business decisions.
Data Professional Survey Breakdown
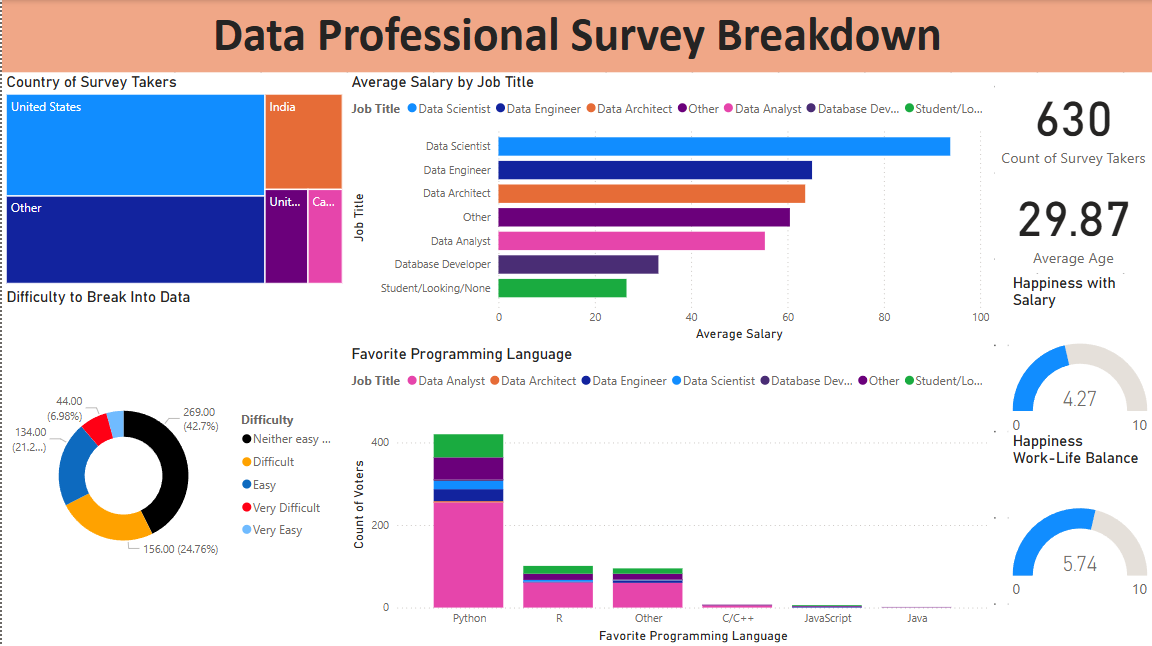
This Power BI report provides a breakdown of survey responses from data professionals. It visualizes key insights related to demographics, salaries, job satisfaction, and industry trends.
Company Quantity Performance Report 2023
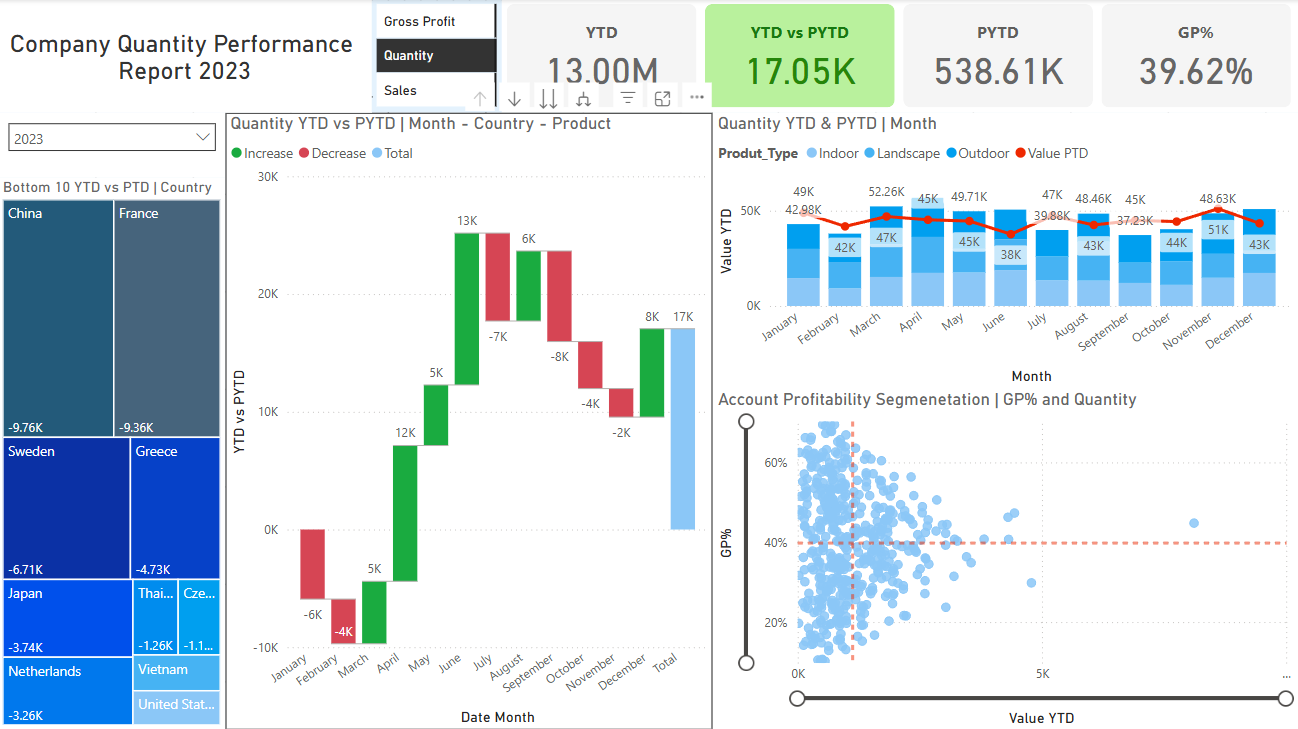
This dashboard presents a high-level view of quantity performance metrics across the year 2023, with comparisons to the previous year (PYTD) and a focus on Year-to-Date (YTD) values.